Sniffing Around
If you are not very knowledgeable in software and computer science (like me; creds to my brother and father for helping me TREMENDOUSLY with this part of my research), then the content of this page will probably be a little more difficult to understand and less interesting. Nonetheless, I wanted to include a description of the programs that I use to analyze camera data to address some of the issues that I’ve encountered thus far when working with the software, as well as tips on how to solve these problems. Obviously there’s no way I’ll be able to cover every possible thing that could malfunction, though I’ll do my best to simply make note of some of the things I’ve run into. Always feel free to comment below or contact me if something still isn’t clear. Finally, one important point I want to emphasize before beginning is that new, updated versions are regularly released of the programs described below. Therefore, any issues I discuss could actually have already been solved by now.
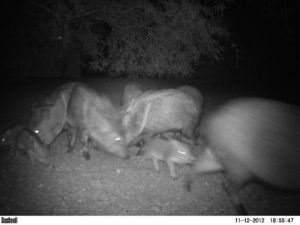
Feeding Frenzy
The three main programs that I use for all my camera data are “ReNamer,” “DataOrganize,” and “DataAnalyze.” Here you can find a PDF link that I employed when first learning how to utilize these to conduct analyses; it is only six pages long and primarily discusses sorting photos (pgs. 1-2), ReNamer (pgs. 3-4), and DataOrganize (pgs. 5-6). The second source I’d recommend is a powerpoint created by Dr. Jim Sanderson, the writer of DataOrganize and DataAnalyze: Workshop Presentation. Additionally, all three programs can be downloaded here from the Small Cat Conservation Alliance’s website, an organization founded by Dr. Sanderson. As a side note, there are many other programs geared toward specific analysis goals under this link, though as of right now I haven’t used any of these. Finally, included next to each download link is a “how to use” option.
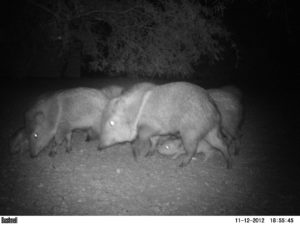
Still Going Crazy
There are three steps involved when evaluating camera trap data: storage, organization, and analysis. However, prior to starting anything, it is recommended to make a copy of all files so as to keep the raw data on hand. After this is done, the original images/videos must be renamed based off of the year, month, day, hour, minute, and second they were taken in. The purpose of this is to give each photo/recording a unique name and thus prevent any overwriting from occurring during sorting. To carry out this feat, a set of “rules” needs to be created within ReNamer that will tell the program how you want the files to be relabeled; the instructional steps are outlined below. Note that this text has been copied and pasted from the PDF that is linked above. Further, for videos, the technique is exactly the same with the exception that in step 4, “File_DateModified” will be selected instead of “EXIF_Date” from the drop-down list.
(1) Open ReNamer by double-clicking on the icon.
(2) Drag and drop an image file, group of image files, or a folder of images into the lower frame of ReNamer. The image files are listed.
(3) Click “+Add” to add the first rule. From the drop-down list select “Delete,” select “Till the end,” skip extension. Click Add Rule. This deletes the name of the file leaving the extension. Don’t worry that it appears as if only one such file had the label deleted.
(4) Click “+Add” to add the second rule. Select “Insert,” then click the yellow lightening bolt Insert Meta Tag, and select from the drop-down list “EXIF_Date.” Then click the green check Insert. Click “+Add Rule.” Now click on Preview at the top. The new names of the files should appear with the date and time that the image was recorded.
(5) Click “+Add” to add the third rule. Select “Replace.” In the Find: box enter “-“, and in the Replace: box enter a space or blank with the space bar on the keyboard. Back in the Find: box, click on the “+” sign to the right of the box, and in the Find: box enter “.”, and then in the Replace: box enter another space. Repeat this for all characters other than numbers. This replaces all the non-number characters with a space. The names of all the files appear as: yyyy mm dd hr mn sc.jpg (or JPG).
(6) Click on Preview on the upper right of the ReNamer box and the new names should appear. If the file label does not appear as yyyy mm dd hr mn sc, you might need to add a rule to delete a few more characters or add a space.
(7) To the right of Preview, click on the green Rename right arrow and the files are relabeled and saved.
(8) From the top menu list select “Presets,” save as, and then give your rule set a name like “MyRules.” You can then use the rules again without re-entering them.
Additionally, it is important to be aware that some camera traps have a “burst” option. If set to this, the device will take consecutive photos all within the same second. Obviously this causes a problem when giving each picture a unique name. However, a program entitled “SpecialReNamer” may also be found on Dr. Sanderson’s website that takes this issue into account; it automatically adds several seconds to burst shots. A second problem that this software resolves is renaming corrupted files that the ordinary ReNamer fails to properly relabel (the date and time may be off). Nonetheless, burst images and corrupted files can also simply be done by hand if there aren’t too many.
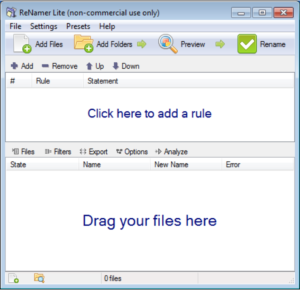
ReNamer Interface
Next, the original, relabeled files to be analyzed are to be placed into an organizational folder structure. The main folder will be entitled “AllLocations” (note: it is important to not have a space between any words in any folders in this hierarchy as this causes the analysis software to malfunction). Several others will then be created within AllLocations, each corresponding to a different camera site. Moreover, it is preferable to title these subfolders based off of the name of the region instead of just “Loc01,” “Loc02,” etc. The next subcategory is animal names. For example, if the first location had only two species photographed (ex. puma and mule deer), one folder should be entitled “01_MuleDeer” and the other “02_Puma” in Loc01 (or whatever you called it). Know also that the reason I placed numbers in front of the names is because the programs didn’t work properly when I excluded them. Finally, the last subfolders are simply numbers analogous to how many animals were in the image/video. Continuing with the example above, if some of the mule deer pictures at the first camera site had one mammal and the rest had two, there would be two folders in “01_MuleDeer”: “01” and “02.” Once this organizational system has been made, every data file is to be placed into its correct place in the hierarchical structure. Moreover, if a photo/video has more than one species in it, a duplicate should be made so that each animal folder has a copy. As a couple last notes, an “unknown” folder should be created for species that can’t be identified, while “ghost” is commonly used if a false trigger occurred and there is nothing in the picture. I’ve also found that all location folders must have the same number of animal folders, even if a species wasn’t photographed at all in a particular region. Additionally, every species category needs to have at least an “01” folder (which again can be empty if an animal wasn’t caught on camera at that spot) for the software to run smoothly.
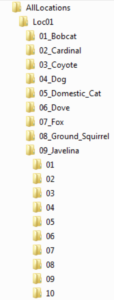
Folder Organizational Structure
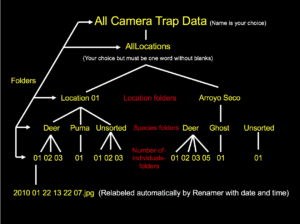
Screenshot taken from Dr. Sanderson’s Workshop Powerpoint, Linked Above
All of the above described stages are encompassed within the first step of storing the data. The second step is organization, which is to be accomplished by using DataOrganize. Opening the program will reveal a black command prompt window (see image below). Type in the available space the folder name that contains all the renamed and stored pictures/videos (“AllLocations,” or whatever you called it. It doesn’t matter as long as there is again no space between words). Also, this folder and a pg.dll file (originating from AntiVirus) need to be located in the same spot as the program icon in order for it to work. Pressing “enter” will then cause the software to start running.
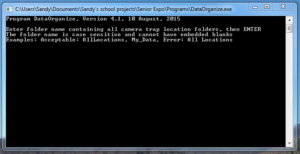
DataOrganize Interface
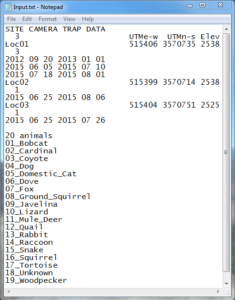
If there was an error, several text files will be created of which one will be entitled “AllInfo.txt.” Opening this and scrolling to the bottom reveals what images/videos were rejected (often simply due to improper renaming). After fixing the issue, run DataOrganize again. If everything goes smoothly, two other text documents should be created: “AllPictures.txt” and “InputTemp.txt.” AllPictures.txt is merely a list of every photo and video in the AllLocations folder, while InputTemp.txt is the file that is to be edited by hand; it can be opened with Notepad or some similar software. Here there’ll be several things for you to fill in, including camera start/stop dates and UTM coordinates of each site with elevation (see the images below for clarification).
As a couple explanatory points, the UTM coords can be obtained by finding the camera locations on Google Earth and converting the Latitude and Longitude coordinates to UTM using an online converter. Additionally, the number under “Site Camera Trap Data” (note: this header can also be changed to what you want to call the study) in the top left-hand corner corresponds with how many different locations there were. In my example below there were three, entitled “Loc01,” “Loc02,” and “Loc03.” Further, notice that each of these names has a number under it as well; this references how many start/stop dates there were for the devices. For example, I had three start/stop times at the first site; these dates are entered as year, month, day. Also, be aware that InputTemp.txt will by default already have start/stop dates entered based off of when the first and last photos/recordings were taken. Thus, if you know the exact days that you set the camera up and took it down, replace the default dates with the actual ones. Lastly, Dr. Sanderson recommends in his powerpoint (linked above) splitting up the species list into categories such as “mammals,” “birds,” etc. and adding those labels. However, when I did this, DataAnalyze malfunctioned; as a result I ended up just putting the number of species that I photographed and used the generic term “animals” (“20 animals;” see bottommost screenshot). Moreover, even though there were only 19 in the example below, I made it 20 since the program counts “20 animals” as a separate species. Finally, once all this is done, InputTemp.txt may be renamed as “Input.txt.”
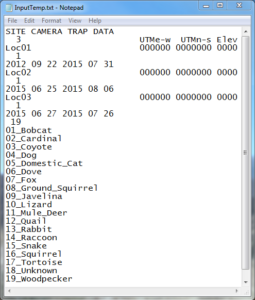
InputTemp.txt Prior to Editing
InputTemp.txt Renamed as Input.txt After Editing
The third and last step in the process is analysis. Here DataAnalyze is to be employed; opening the program brings up a black command prompt window much like the one from DataOrganize. The only difference is that instead of typing in a folder name, you’ll be entering what is known as the “period” value. This is the amount of minutes that constitute an “independent picture.” For example, if the number entered is “60” (an hour; this or 30 is typically recommended) and a particular animal is photographed more than once within that time frame, all images of that species in that hour period count as an independent picture, not several separate ones. Finally, upon pressing “enter,” the program will use the entered value along with “AllPictures.txt” and “Input.txt” to create a final text file entitled “Output.txt” (in addition to “Reject.txt” if some images/videos weren’t included in the analysis for some reason). Further, remember again that AllPictures.txt, Input.txt, and a pg.dll file need to be in the same spot as the DataAnalyze icon in order for everything to work properly.
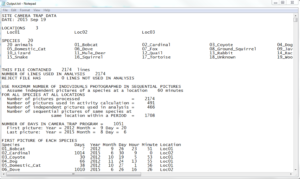
Top Portion of Output.txt
The screenshot above shows what the top part of the analysis file looks like. Note the tiny scroll bar on the right-hand side; the entire document is enormous. Nonetheless, most of the output won’t even be used; the idea is rather to pick and choose what you want. For example, one analysis is entitled, “Number of Pictures by Species by Year” (see image below); this is one that I commonly use. Notice as well that there are several subcategories under here called “Activity,” “Period,” and “Abundance,” among others. Considering that these terms come up rather frequently, I’ll briefly define them. However, attached here is a text document sent to me by Dr. Sanderson that describes what every analysis category in the output file means.
The “period” is the value you entered into the DataAnalyze command prompt. Thus, the number under here will indicate how many independent pictures you got with that period value; see the description above for what an “independent picture” is. Abundance is the maximum number of individuals from each independent picture added up for the entire study. As an example, assuming the period is 60, if only two photos were captured (within an hour) of a puma for the whole project, and one image had two animals while the other had three, the final abundance value would be three. Activity, on the other hand, doesn’t use independent pictures to calculate its values. It instead just focuses on whether a species was photographed every hour for the duration of the study. For example, if an animal were caught on camera several times from 10-11 and once from 11-12 for only one day of the entire project, the final activity value would be two.
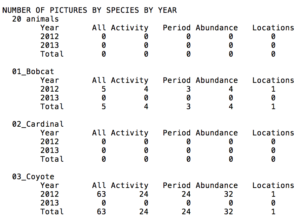
Snippet of the Output File
The final step of analysis is to create graphs and charts of the data in Excel or similar software spreadsheets using the desired numbers from the output file.
All in all, ReNamer and Dr. Sanderson’s programs have been an enormous help to the scientific community. Additionally, to reiterate what I stated at the top of this post, some issues described above may already have been solved in updated versions of the software. Be sure to keep this in mind when downloading the programs.